
Value Line Multi Cap Global SMA
Seize the potential for growth by investing in U.S.-listed companies that generate significant revenues from foreign (non-U.S.) business activities. The Value Line Multi Cap Global SMA enables investors to participate in global growth by owning share in companies that generate more than 50% of their revenues from activities outside of the U.S. By investing in this portfolio of publicly traded companies, investors can enjoy the transparency and regulatory benefits of the U.S stock markets while gaining significant portfolio exposure to revenues generated from international business opportunities.
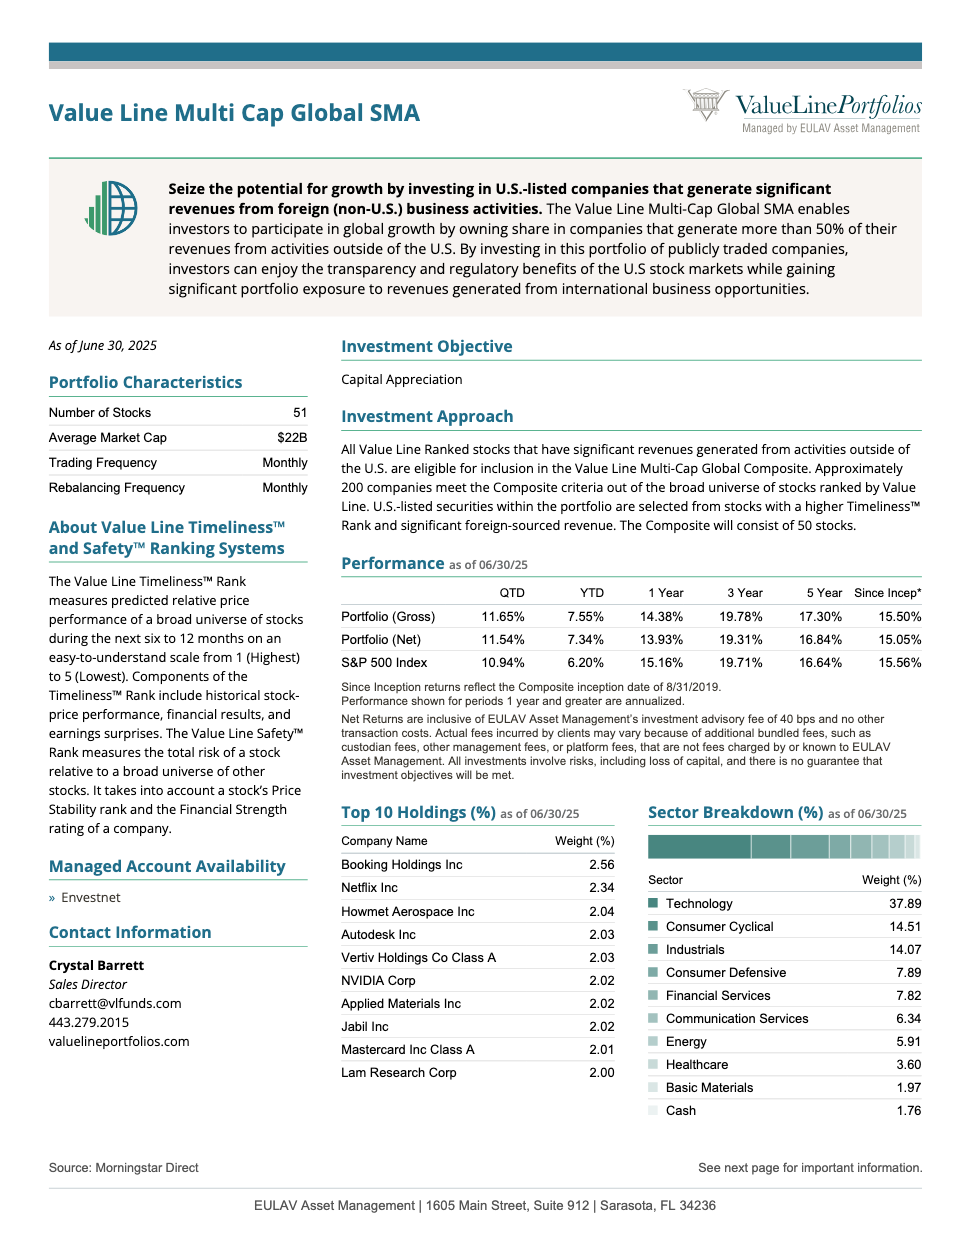
Investment Objective
Capital Appreciation
Portfolio Characteristics
| Characteristic | Value |
|---|---|
| Number of Stocks | 51 |
| Average Market Cap | $22B |
| Dividend Yield | 1.08% |
| Trading Frequency | Monthly |
| Rebalancing Frequency | Monthly |
Investment Approach
All Value Line Ranked stocks that have significant revenues generated from activities outside of the U.S. are eligible for inclusion in the Value Line Multi Cap Global Composite. Approximately 200 companies meet the Composite criteria out of the broad universe of stocks ranked by Value Line. U.S.-listed securities within the portfolio are selected from stocks with a higher Timeliness™ Rank and significant foreign-sourced revenue. The Composite will consist of 50 stocks.
How Stocks Are Selected
The Portfolio will consist of stocks meeting the following criteria:
- Stocks with over 50% of revenue from outside the U.S.
- Higher Value Line Timeliness™ Rank
- The Portfolio consists of approximately 50 stocks
- Stocks are reselected and equally weighted each month
Top 10 Holdings (%) as of 12/31/25
| Company Name | Weight (%) |
|---|---|
| Booking Holdings Inc | 2.66% |
| Lam Research Corp | 2.36% |
| Herbalife Ltd | 2.28% |
| The Western Union Co | 2.24% |
| Pricesmart Inc | 2.23% |
| Monolithic Power Systems Inc | 2.22% |
| Howmet Aerospace Inc | 2.21% |
| Applied Materials Inc | 2.17% |
| Lear Corp | 2.14% |
| Ingredion Inc | 2.12% |
Performance as of 12/31/25
Sector Distribution as of 12/31/25
| Sector | Weight | |
|---|---|---|
| Technology | 38.81% | |
| Industrials | 15.96% | |
| Consumer Cyclical | 14.82% | |
| Financial Services | 8.38% | |
| Consumer Defensive | 6.78% | |
| Energy | 5.65% | |
| Healthcare | 4.06% | |
| Communication Services | 3.52% | |
| Cash | 2.11% | |
| Basic Materials | 2.02% |
Source: Morningstar Direct.
How to Invest
Separately managed accounts are provided by EULAV Asset Management. The Value Line Multi Cap Global SMA is currently available at Envestnet.
Portfolio Fact Sheet
Portfolio GIPS Report

Do you have questions?
Please reach out to our SMA support team at:
