
Investment Process
An Optimized Investment Approach to Balancing Risk and Return
The Value Line Portfolios’ quantitative approach integrates the Value Line Ranking System for Timeliness™ with a multifactor risk model that incorporates each stock’s risk profile and fundamental characteristics (e.g. size, momentum, growth rate, industry, etc.) to construct a diversified portfolio using a disciplined, repeatable process.
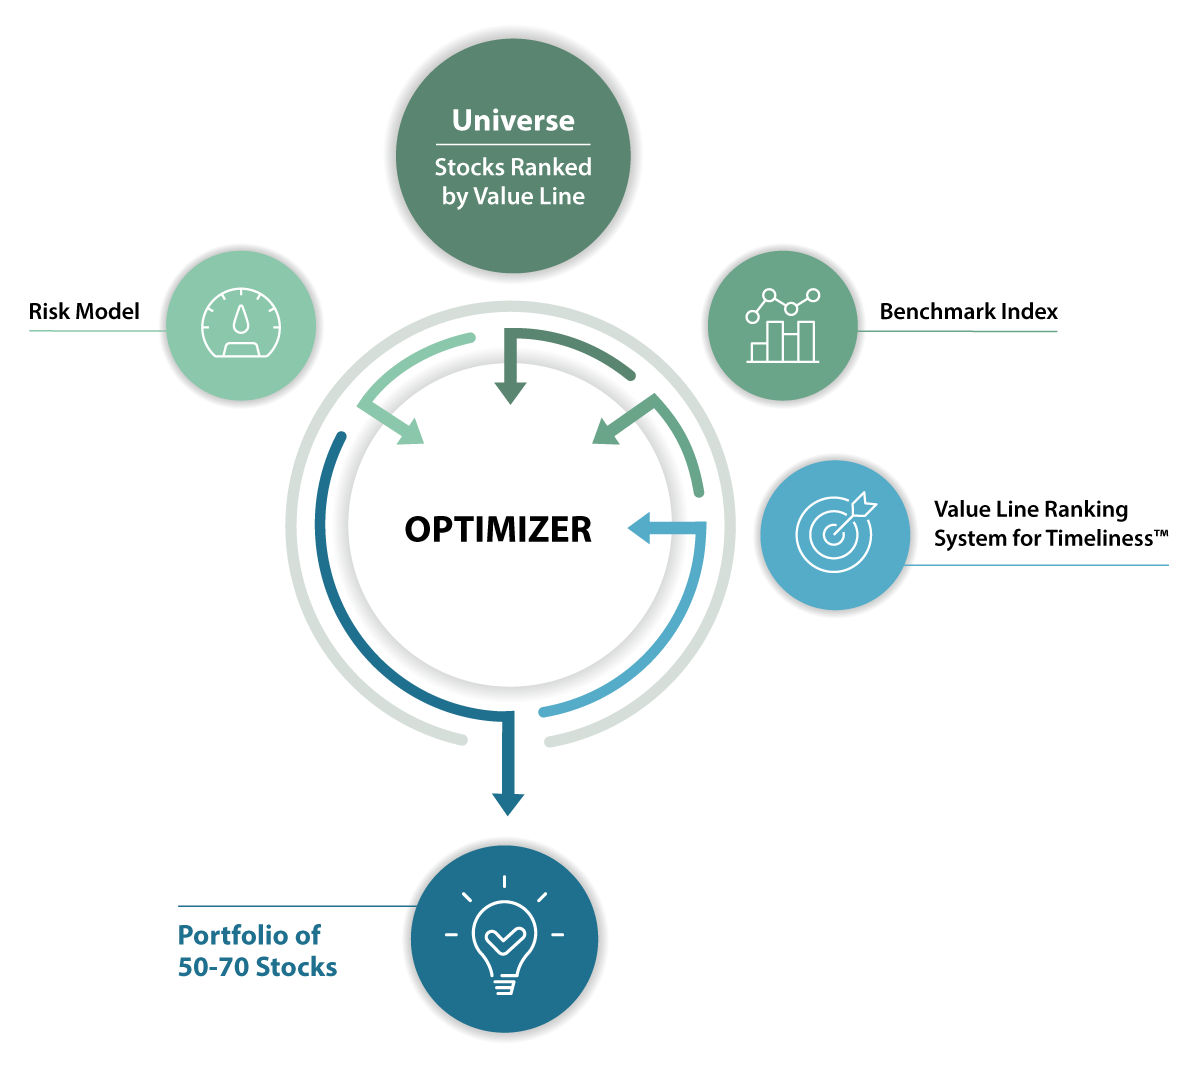
Stocks in the Value Line Ranking System for Timeliness™ system are optimized against each SMA’s strategy benchmark index for possible inclusion in the portfolio. The optimization process selects stocks and determines their relative portfolio weighting, balancing risk and reward, as projected by the Value Line Ranking System for Timeliness™.
Each strategy portfolio consists of approximately 50-70 stocks. Stocks are selected and rebalanced each month.
Do you have questions?
Please reach out to our SMA support team at:
